CheXplain: A minimum viable healthcare product/prototype that explains how a multi-class deep learning algorithm makes chest X-ray classification decisions
✅ You can test out the platform (we provide sample images for your convenience 💪🏾 ) at https://chexplain.trinlytics.com! 👀
Background
Physicians are inundated with numerous amounts of healthcare information regarding a patient's health. These multi-modal datasets all provide valuable information; however, they are often disparate, and so combining them to make meaningful diagnosis is time-consuming. This provides us an opportunity to create tools that seamlessly fit into current clinical workflows.
While x-rays are the most common and more widely diagnostic imaging technique in the healthcare space, the image acquisition and quality varies by device and operator. Despite having large amounts of data, it makes it very difficult to develop a general algorithm that can cover all the pathologies that x-rays can identify in a clinical setting. Hence, most of the recent papers in this space have been limited to developing either disease-specific algorithms or algorithms with a handful of labels. As a result, these approaches were limited in the generalizability of algorithms across all the pathologies that could be identified from an x-ray image.
Therefore, the main goal of this project is two-fold:
- To push the limits of modeling a larger number of pathologies (greater than 14) without overfitting the data by combining multiple datasets.
- Regardless of the accuracy of any model developed, to rapidly prototype, develop, and deploy an interface around a given model that would define a typical clinical workflow. This way, whenever the model was improved and accuracy was increased, the newer model was able to be dropped in and replace the older model without any changes to the enclosing interface.
It is our hope that by providing class activation maps, a radiologist can see what the model was last focusing on while analyzing an x-ray image to potentially improve clinical efficiency. This could also help to draw attention to additional co-morbidities that are difficult to identify that might be present in the image.
Research Question
In this project, we are exploring building an end-to-end platform that allows x-rays to be automatically identify pathology. There have been significant advances in using convolutional neural networks (CNN) to classify images. However, many of these approaches have either focused on a specific disease or on the top-k most frequent diagnosis. Hence, the approach we initially started with was to understand how our end-user (physicians) may interact with a radiology report and the actual x-ray images. Once we understood how they might be used, we then tried to understand what were some of the workflow challenges involved with efficiently using chest x-rays to diagnosis patients. Dr. JaBaris Swain, MD, MPH was invaluable helping explain clinical workflows and how to correctly categorize disease diagnoses. This knowledge was then used to develop a multi-class convolutional neural network (CNN) based on a similar architecture to DenseNet as described in CheXNet: Radiologist-Level Pneumonia Detection on Chest X-Rays with Deep Learning to help address images that may have multiple co-morbidities versus images with one single annotation. We then took what we learned about the end-user's workflow to develop and prototype a web-based minimum viable product (MVP).
Importance of Consulting with the Domain Expert / End User
In an age where the hype around machine learning’s (ML) potential is being touted as the magic solution to all business problems, researchers sometimes overlook the fact that applying ML-based solutions is a scientific process. As such, the fundamentals of science heavily apply to any project whether ML-based or not. More specifically, as a healthcare professional, this means that we need to set clear expectations and seek the input from domain experts/clinicians before and during development. While innovative ML tools and techniques are being developed at a rapid pace, ML practitioners can sometimes get drawn into the novelty of applying newer approaches without realizing that the fundamentals of science make many of these algorithms impractical for some healthcare-facing solutions. In order to ensure that these projects are scalable, we need to set clear expectations and spend time understanding, not only the ML solutions, but, more importantly, the science behind the diseases under investigation. In addition, researchers often forget that these systems will be used by an end-user, so it is equally important that the end user’s workflow is considered to ensure that the lab-to-real-world transition is successful.
To help illustrate how one can go from idea to model to MVP by quickly prototyping, we worked together as a very small team to demonstrate how one can develop and prototype models in close communication with the product end-user.
Dataset
The models were built using two chest x-ray datasets which were combined:
- Open-i dataset
- NIH Chest X-ray 14 dataset
Open-i Dataset (Indiana University)
Open-i service of the National Library of Medicine enables search and retrieval of abstracts and images (including charts, graphs, clinical images, etc.) from the open source literature, and biomedical image collections. Searching may be done using text queries as well as query images. Open-i provides access to over 3.7 million images from about 1.2 million PubMed Central® articles; 7,470 chest x-rays with 3,955 radiology reports; 67,517 images from NLM History of Medicine collection; and 2,064 orthopedic illustrations.
(Open-i)
In this study, we utilized the 7,470 chest x-rays with 3,955 radiology reports dataset. The images were further broken down into lateral (n=3664) and frontal views (n=3806). The images were fully de-identified using a robust anonymization process. However, of the 3,955 chest x-rays, a few reports were deemed uninterpretable.
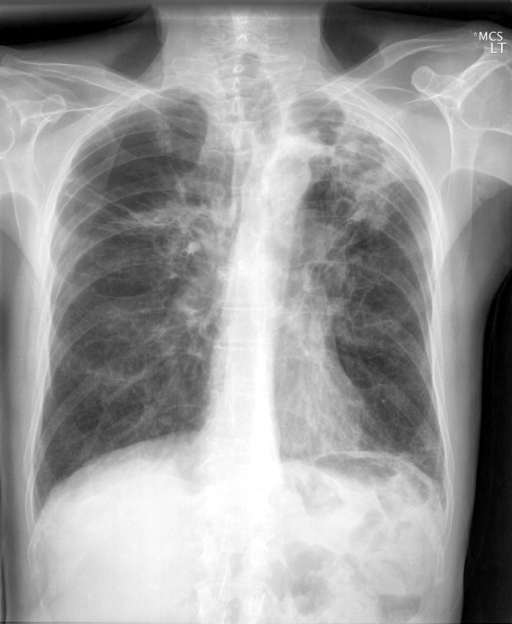
Fig. 1: A sample of an abnormal frontal chest x-ray.
The accompanying radiology reports were structured in the following format with the key sections "Comparison", "Findings", and "Impression" aligned with common radiology report formatting for diagnostic chest x-rays. The example below shows the aforementioned format and the aggressive nature of the anonymization process. In this example, we can see that the disease label was incorrectly classified as personal information, and thus redacted (XXXX). In order to efficiently annotate the images with a controlled vocabulary of terms, the MEDLINE Medical Subject Heading (MeSH) terms were extracted from the XML report and used as annotations for training. However, this leads to the occurrence of multi-labeled images, since MeSH terms infrequently appear alone, as shown in the example below (for example: Cicatrix/lung/upper lobe/left). This patient has 8 MeSH terms associated with this image. Hence, several previous studies' labels were limited to the k most frequent. While this helps simplify the modeling process, it results in the lost of precious data. This is evident in Shin et al.'s work where this frequent k approach to reduce dealing with the complexity of the labels resulted in a final cohort that was about 40% of the full dataset (~2700 images, frontal views only). The impact of this smaller cohort was evident since the author reported significant overfitting of the feature extraction CNNs.
                             FINAL REPORT
TITLE:  Indiana University Chest X-ray Collection

INDICATION: XXXX-year-old XXXX with XXXX.

TECHNIQUE:  Chest PA and lateral

COMPARISON:  None available

FINDINGS: There are diffuse bilateral interstitial and alveolar opacities consistent with chronic obstructive lung disease and bullous emphysema. There are irregular opacities in the left lung apex, that could represent a cavitary lesion in the left lung apex.There are streaky opacities in the right upper lobe, XXXX scarring. The cardiomediastinal silhouette is normal in size and contour. There is no pneumothorax or large pleural effusion.

IMPRESSION: Bullous emphysema and interstitial fibrosis.
1. Probably scarring in the left apex, although difficult to exclude a cavitary lesion.
3. Opacities in the bilateral upper lobes could represent scarring, however the absence of comparison exam, recommend short interval followup radiograph or CT thorax to document resolution.

MeSH: Pulmonary Disease, Chronic Obstructive
      Bullous Emphysema
      Pulmonary Fibrosis/interstitial
      Cicatrix/lung/upper lobe/left
      Opacity/lung/apex/left/irregular
      Opacity/lung/upper lobe/right/streaky
      Opacity/pulmonary alveoli
      Opacity/lung/bilateral/interstitial/diffuse
Fig. 2: A example of the radiology report for an abnormal frontal chest x-ray.
NIH Chest X-ray 14: The National Institutes of Health Chest X-ray Dataset
This NIH Chest X-ray Dataset is comprised of 112,120 X-ray images with disease labels from 30,805 unique patients. To create these labels, the authors used Natural Language Processing to text-mine disease classifications from the associated radiological reports. The labels are expected to be >90% accurate and suitable for weakly-supervised learning.
(Wang et al.)
Data Pre-processing
In order to simplify the image annotation process, MeSH terms for each image were first limited to first-level term of the MeSH vocabulary hierarchy. For example, in this example label from Fig. 2, Cicatrix/lung/upper lobe/left was reduced to Cicatrix. This reduced the context, but also limited the amount of label duplication since many of the lower level terms give more granular context into the exact organ and location of the finding. This can be further explored with the cascading approach used by Shin et al. The dataset was then combined with the NIH Chest X-ray 14 dataset, which has a total of 112,000 images. Terms with fewer than 100 occurrences were also removed from the final cohort, and about 80% (n=94292), 10% validation (n=11176) and 10% test(n=10363) of the initial frontal dataset cohort (n=115831) was retained for modeling.
Phase One: Multi-class Image Classification Initial Approach Ideation
In this project, we began with classifying the images using a series of iterative approaches starting from:
-
Create a binary classifier to ensure that the image uploaded to the platform was a frontal image.
-
Create a binary classifier to ascertain the presence or absence of pathology in the uploaded x-ray image.
-
Create a multi-class model that further classify the images into the ABCDE x-ray categories:
- A: Airway
- B: Bone
- C: Circulatory
- D: Devices
- E: Everything Else
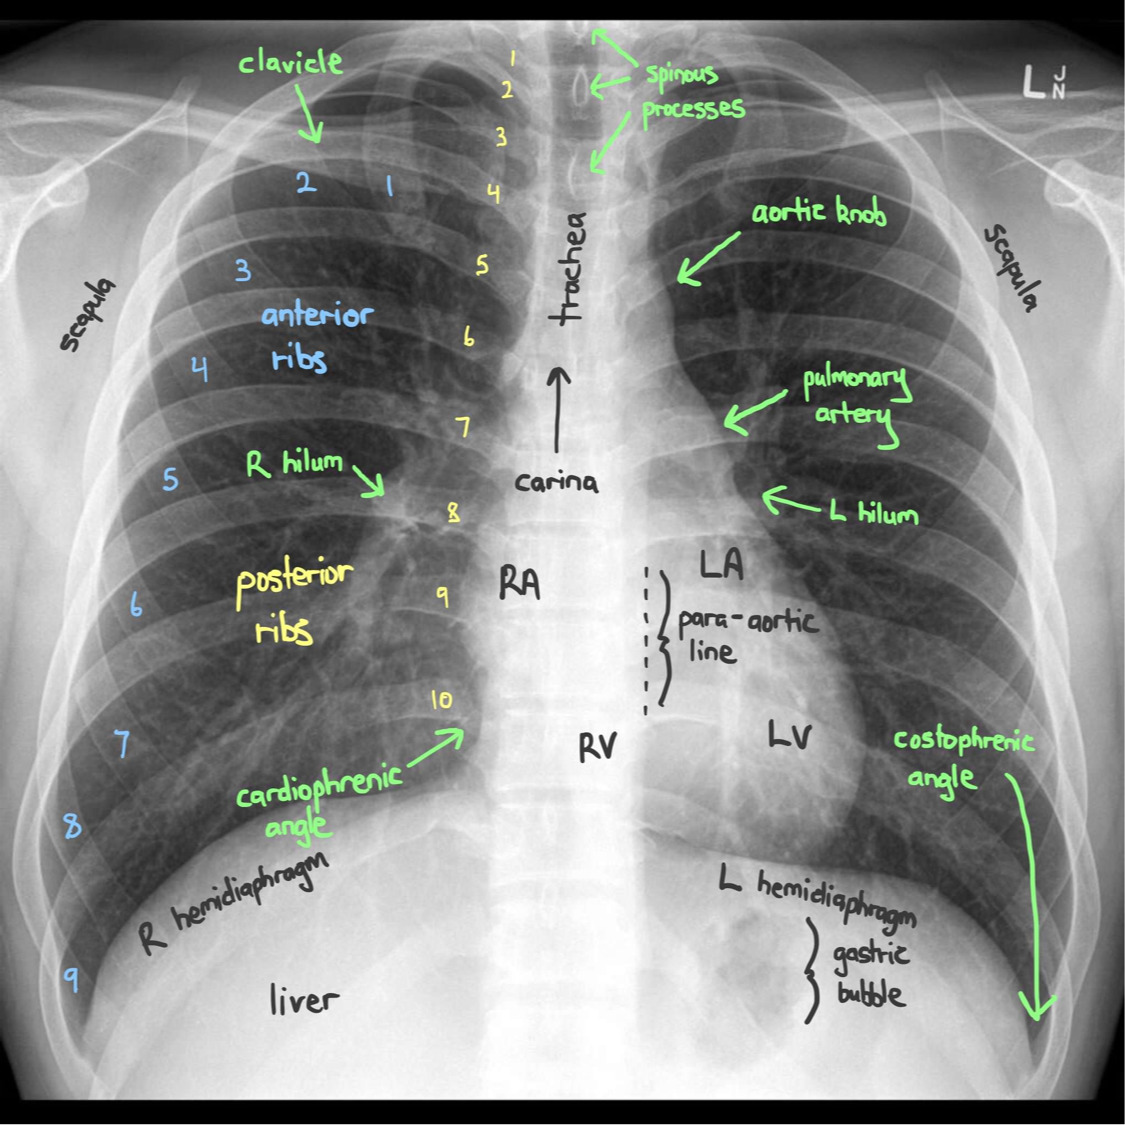
Fig. 3: A rough schematic of how radiologists read x-rays.
The categorization we decided to use for our modeling approach based on the above categories were as follows:
| Airway | Bone | Circulation | Devices | Everything Else |
|---|---|---|---|---|
| Airspace disease | Spine | Aorta | Catheters | Calcinosis |
| Atelectasis | Thoracic vertebrae | Atherosclerosis | Support devices | Cicatrix |
| Calcified granuloma | Cardiomegaly | Consolidation | ||
| Edema | Deformity | |||
| Effusion | Density | |||
| Emphysema | Diaphragm | |||
| Granulomatous disease | Fibrosis | |||
| Infiltration | Hernia | |||
| Lung | Markings | |||
| Pneumonia | Mass | |||
| Pneumothorax | Nodule | |||
| Opacity | ||||
| Pleural thickening |
Table 1: A table showing how diseases were grouped.
Prototyping / Wireframing the Front-end Interface
Once we aligned on the modeling approach (nowhere near perfect), we kept in mind that we would need more data to make the models perform at full capacity. We decided to draft front-end wireframes to ensure that our model outputs aligned with the front-end user interface. This was done using a tool Balsamiq. In a way, this can be described as "API-First Development" since we wanted to make sure that we formatted our output data in a way to allow us to present our findings clearly and interactively.
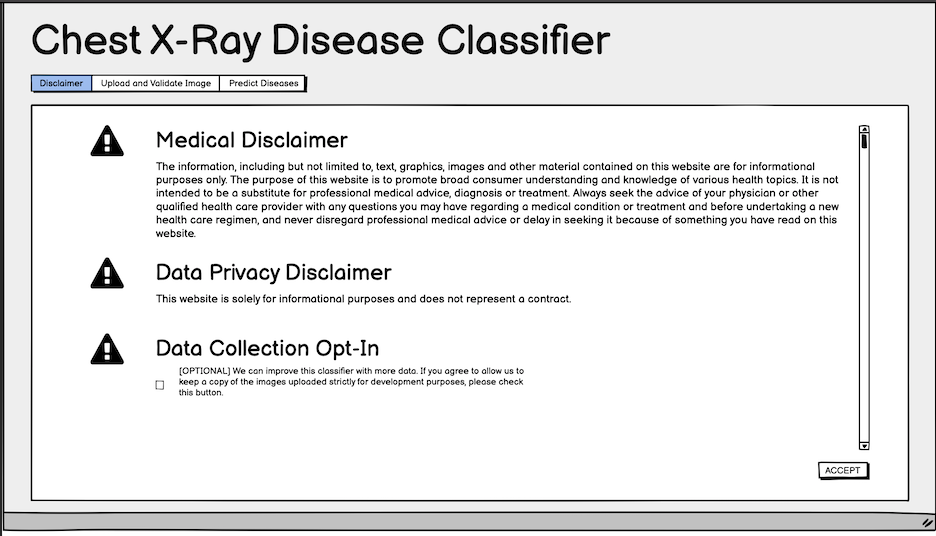
Fig. 4: Initial wireframe for the disclaimer.
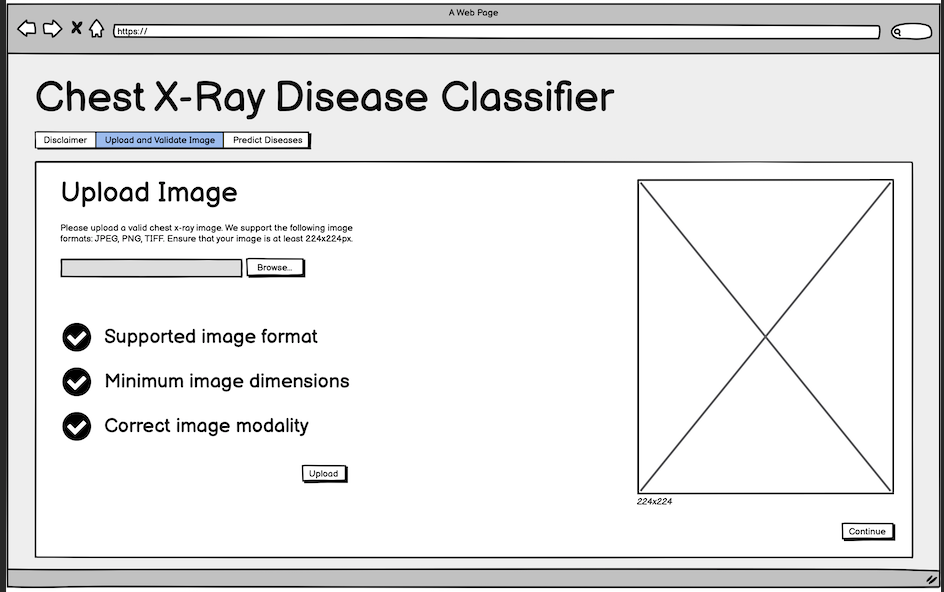
Fig. 5: Initial wireframe for the upload step.
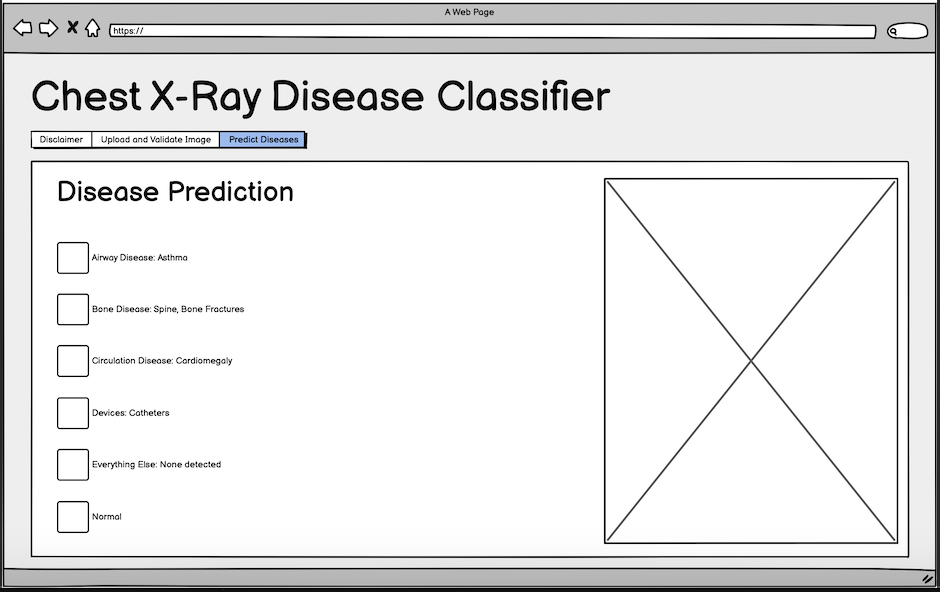
Fig. 6: Initial wireframe for disease prediction step.
Final Platform Details
The final platform is powered by three models:
Image Upload Step
On the image upload step (Fig. 7), we built a simple binary classifier initially used to filter out the the lateral view images from frontal image views. This was done using a pre-trained ResNet-18 model on 400 (200 train, 200 validation) randomly selected images from the Open-i dataset and achieved an accuracy of ~99%. The algorithm was used to help us quickly isolate all 7,470 images for further modeling objectives. We then decided to use this model to enforce image view requirements on all images uploaded to the platform.
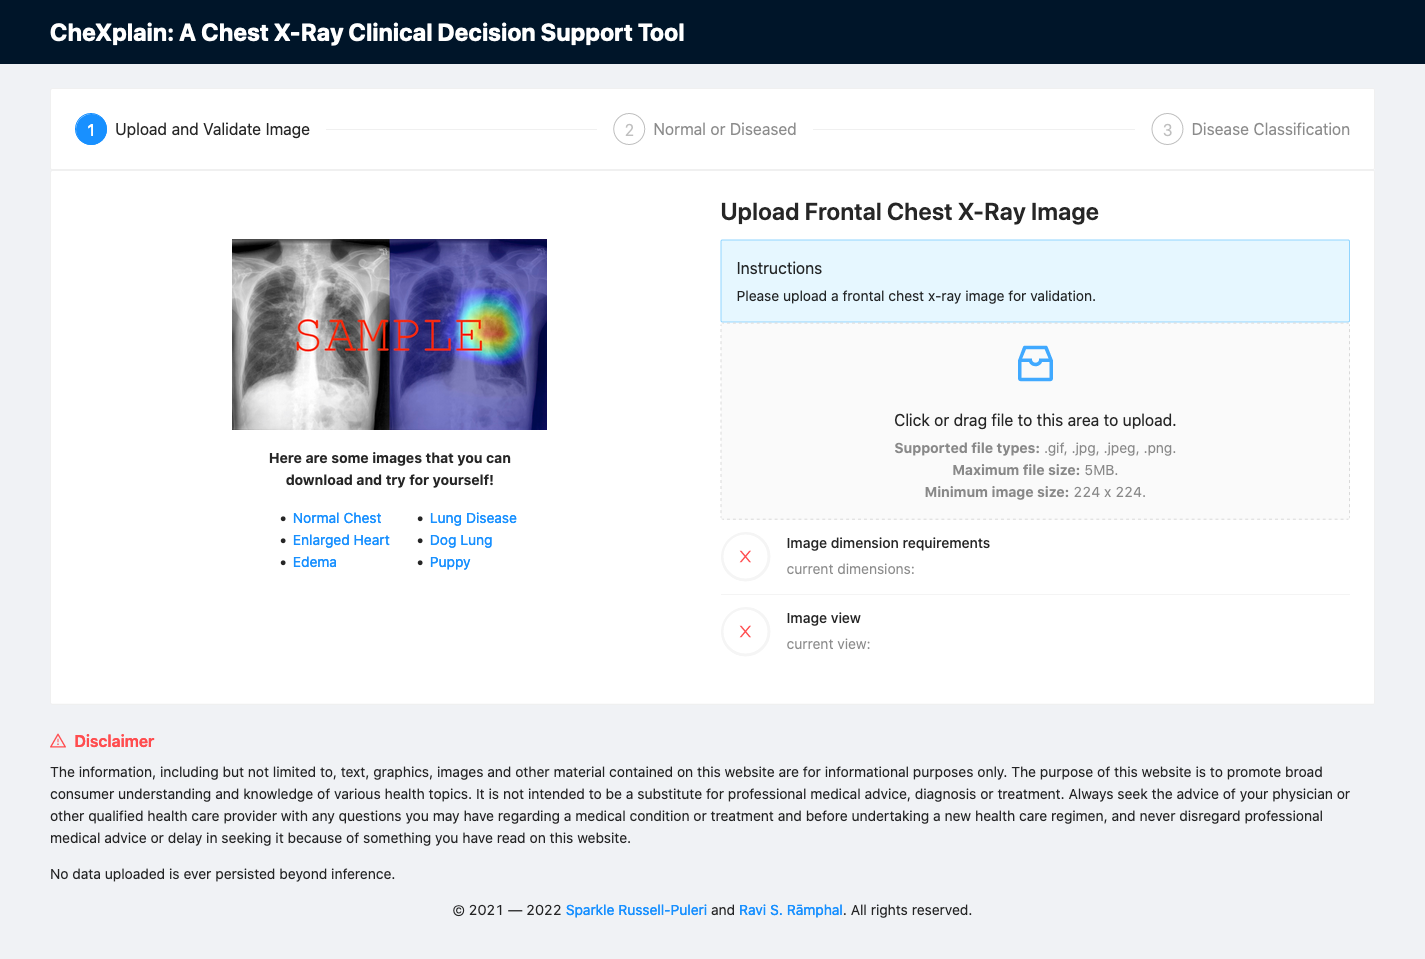
Fig. 7: A screenshot of the platform upon initial load.
How to Use The Interface
- Upload a frontal chest x-ray image. This can be done by dragging or clicking on the upload section shown below. If the image meets both the view and dimensions criteria, the "Continue" button will be displayed and the user will be allowed to proceed to the second step.
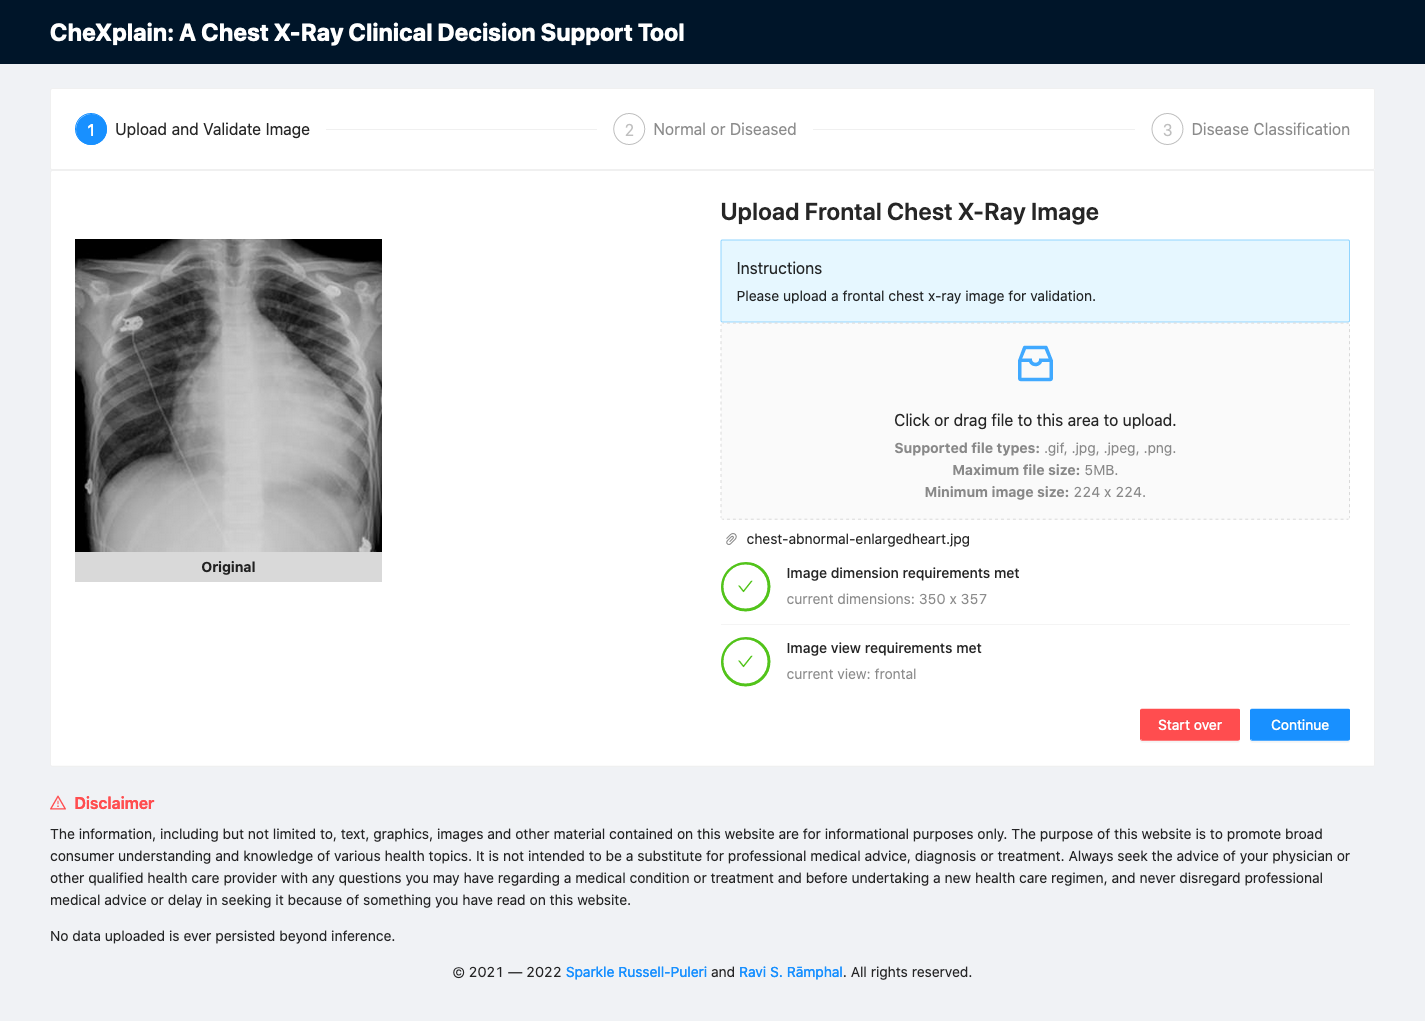
Fig. 8: A screenshot of the platform after uploading an image.
- If the image is not a frontal x-ray image or if it does not meet our image dimension requirements, the image view model will not allow the user to proceed to the disease ascertainment step.
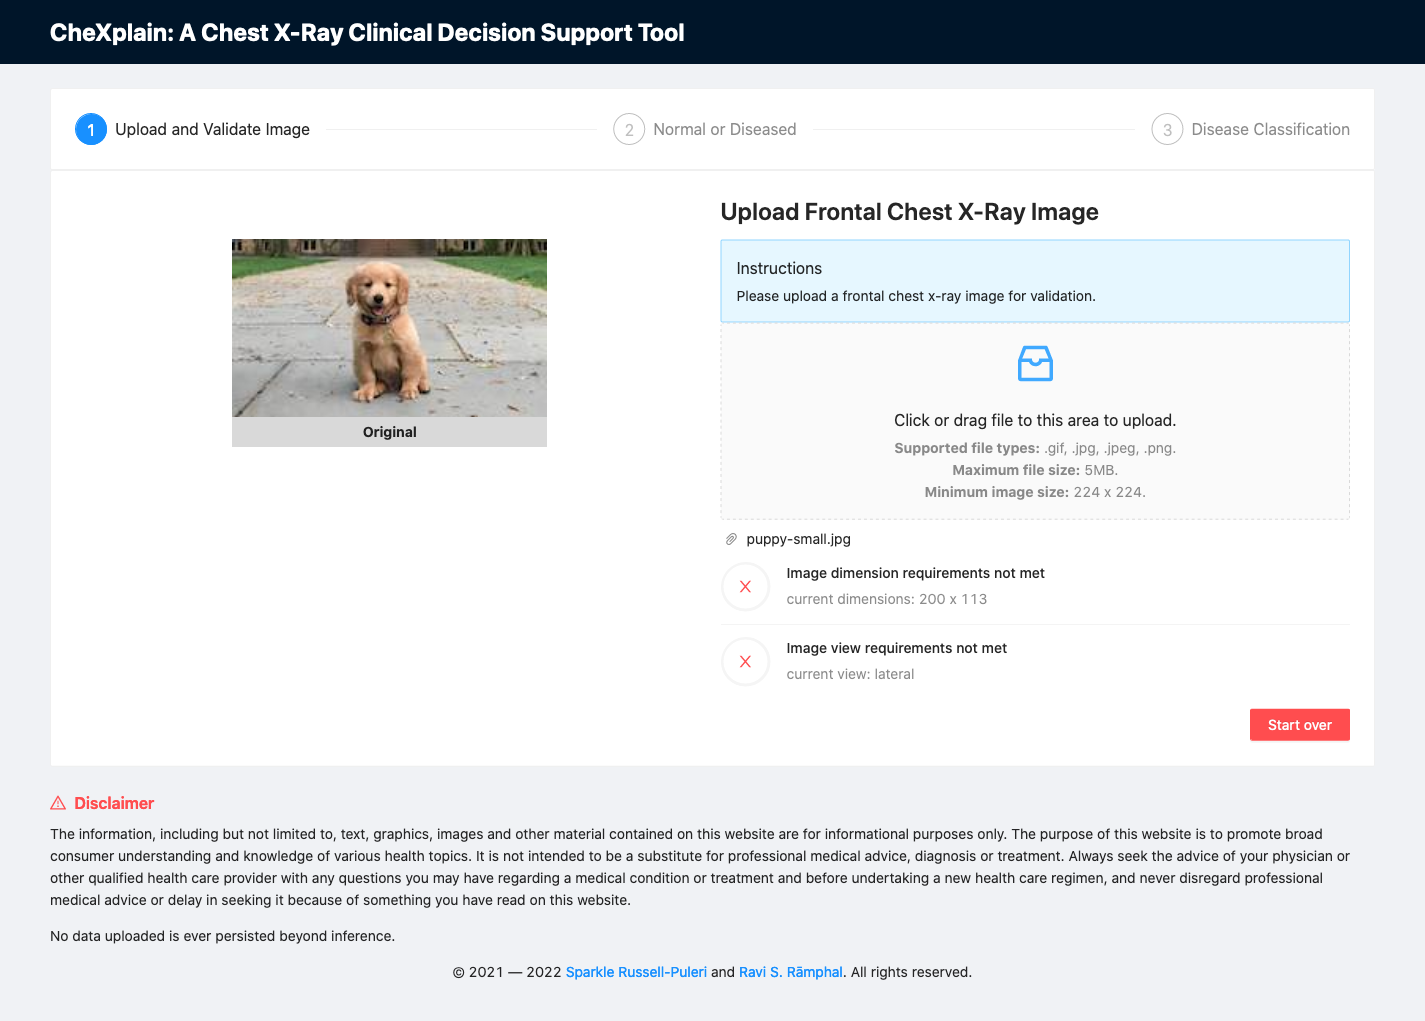
Fig. 9: A screenshot of the platform after uploading an image that fails to meet image dimensions and image view classifier requirements.
Abnormality Classification Step
At this step, we used a simple binary classification algorithm (ResNet-18 model) to train on a combination of Open-i and NIH-14 datasets (N= 115,598; after removing low quality images). The overall accuracy of this model was ~79% (AUC). The labels were manually reconciled across both datasets to ensure consistency using our clinical expert. It is also key to note that if an image is deemed normal (no pathology), the user can no longer proceed to the disease classifier, but can go back or start over and upload a new image for analysis.
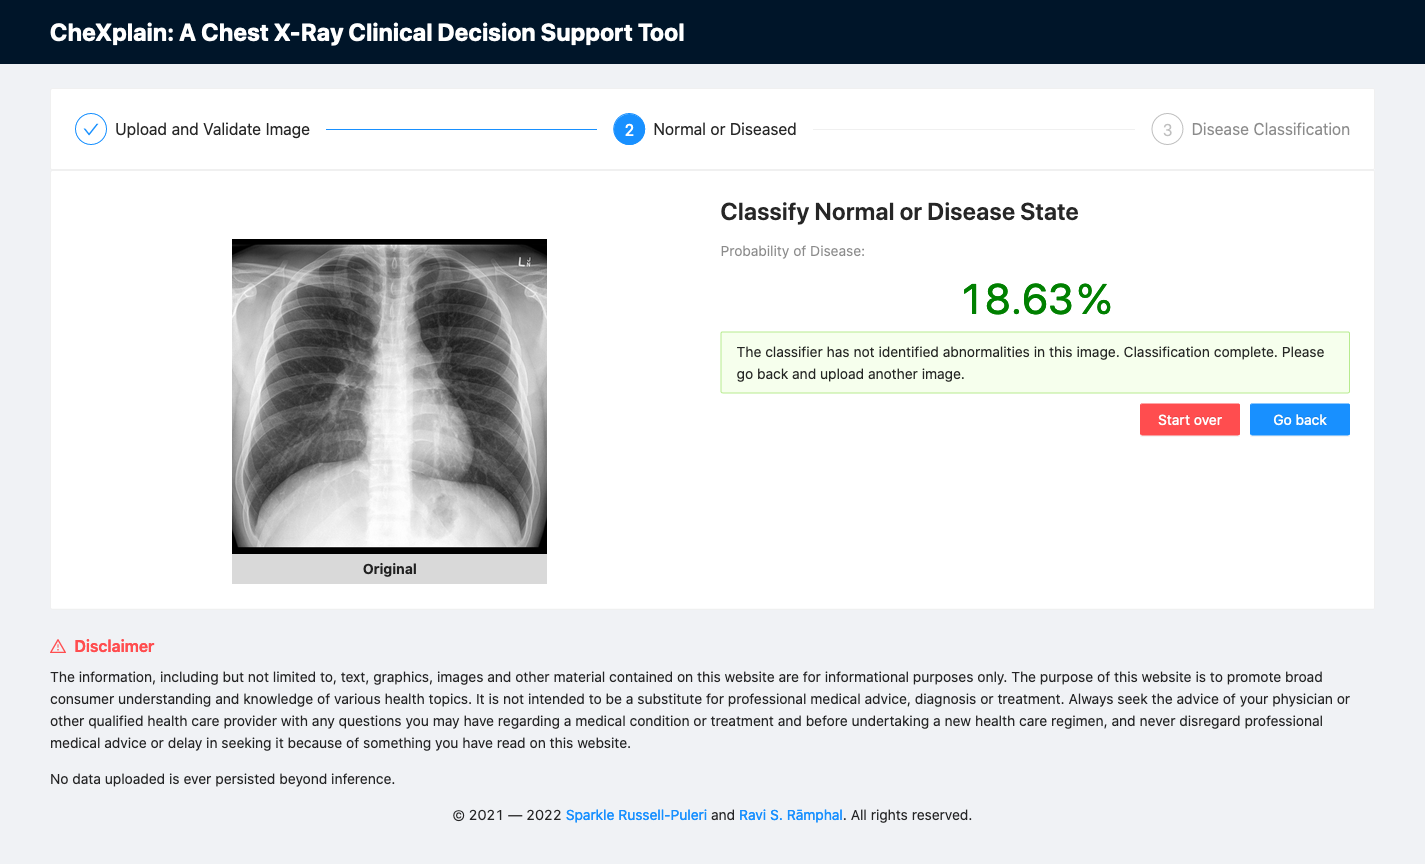
Fig. 10: A screenshot of the platform showing the second classifier reporting a normal scan.
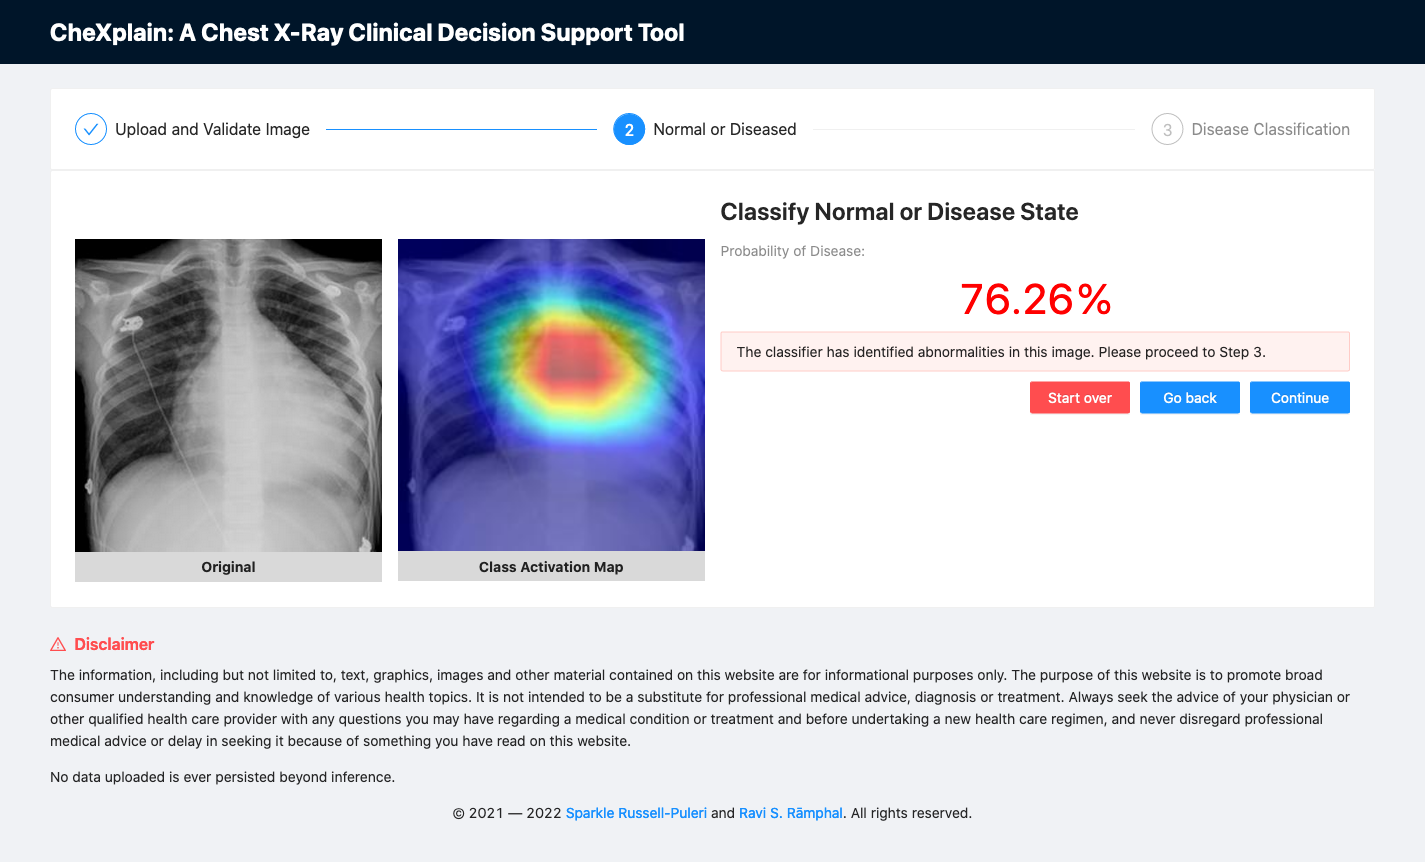
Fig. 11: A screenshot of the platform showing the second classifier reporting an abnormal scan.
Disease Classification Step
Finally, if an image is deemed abnormal, the image will then be sent to a multi-class classifier. This multi-class model was an adaptation of the CheXnet model (DenseNet-121), which classified 14 of the most common conditions using the NIH Chest X-ray 14 dataset. In our model, we decided to classify 31 classes and provide accompanying class activation maps across all labels to show the physician where the algorithm was focusing when it made the final decision for each label using an aggregated cohort of both Open-i and NIH-14 datasets. 31 was the maximum number of classes we could use for training without having severe data imbalance. We leveraged the front-end to regroup each label into its respective "ABCDE" x-ray category so that more junior clinicians could also use this as a learning tool.
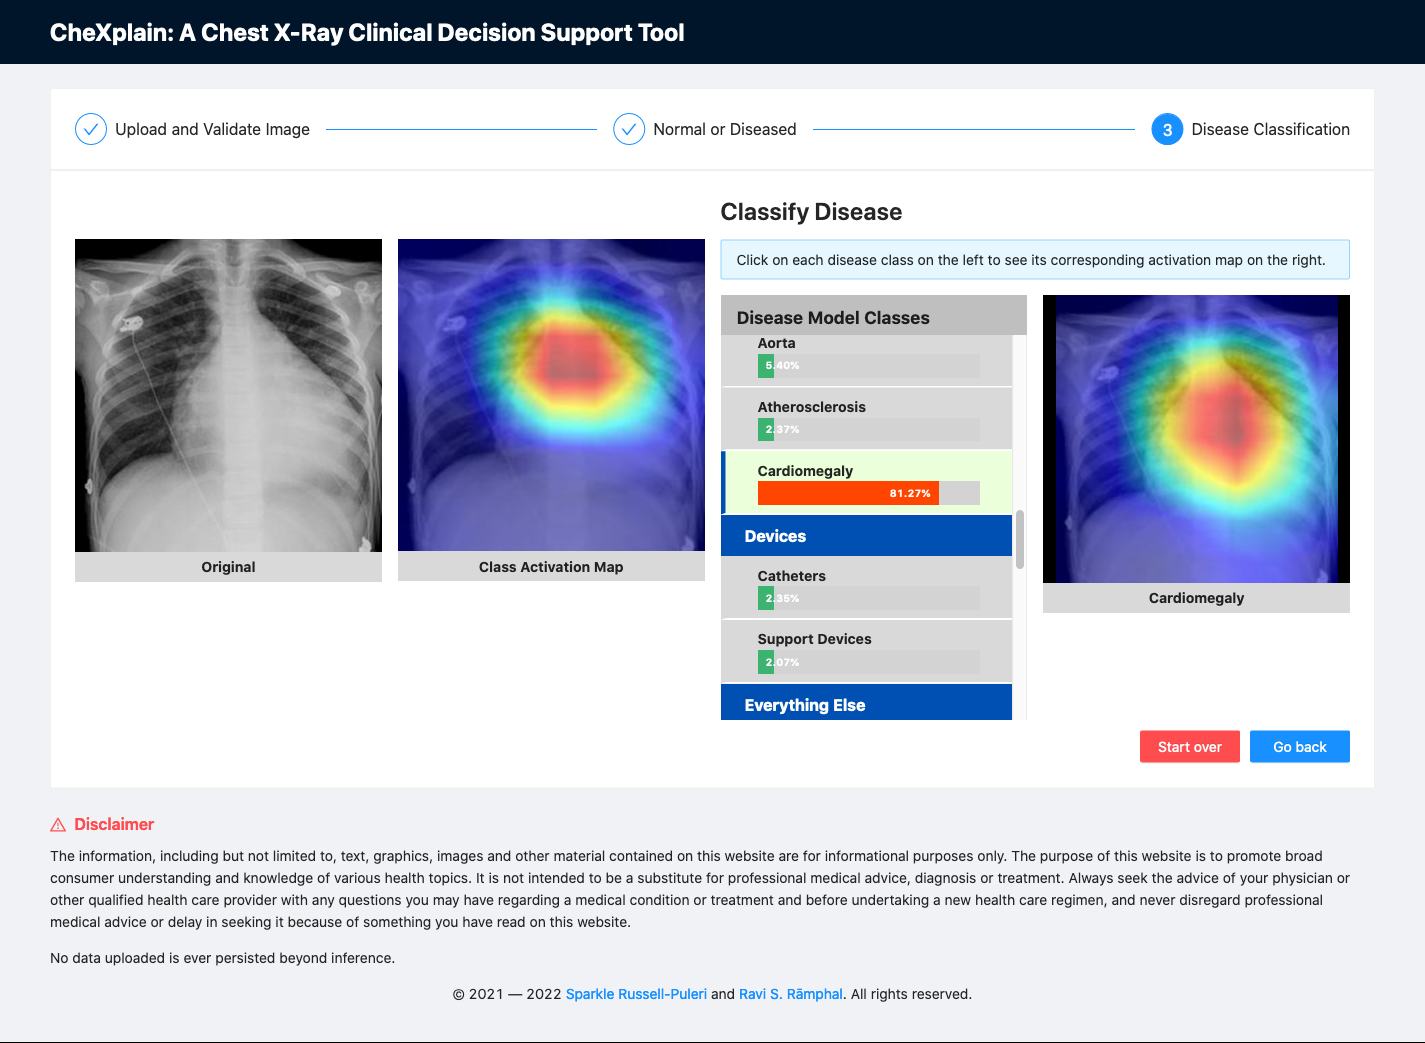
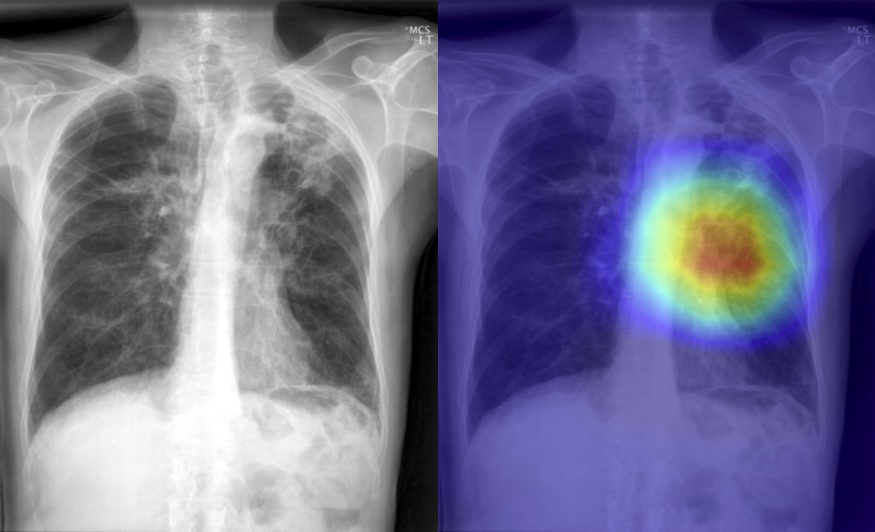
Fig. 12: A screenshot of the platform showing class activation maps associated with each label.
We are aware that the model is clearly overfitting for some of the labels listed in the table below. Given the low number of instances for some labels, we have done as much as we can to simplify the model to mitigate overfitting.
| Label | AUC |
|---|---|
| airspace disease | 0.996 |
| aorta | 0.996 |
| atelectasis | 0.811 |
| atherosclerosis | 0.970 |
| calcified granuloma | 0.986 |
| calcinosis | 0.99 |
| cardiomegaly | 0.895 |
| catheters | 0.993 |
| cicatrix | 0.993 |
| consolidation | 0.805 |
| deformity | 0.994 |
| density | 0.991 |
| diaphragm | 0.994 |
| edema | 0.897 |
| effusion | 0.878 |
| emphysema | 0.911 |
| fibrosis | 0.831 |
| granulomatous disease | 0.995 |
| hernia | 0.886 |
| infiltration | 0.709 |
| lung | 0.989 |
| markings | 0.996 |
| mass | 0.829 |
| nodule | 0.764 |
| opacity | 0.985 |
| pleural_thickening | 0.785 |
| pneumonia | 0.759 |
| pneumothorax | 0.869 |
| spine | 0.992 |
| support_devices | 0.993 |
| thoracic vertebrae | 0.993 |
Table 2: Area under the curve (AUC) of each label in the dataset.
Limitations / Next Steps
While these results may look promising at first glance, this dataset is highly unbalanced. To help address this, we explored using various stratification tools for multi-labeled datasets. However, we did not see a difference in performance, but, as a first pass, we wanted to first demonstrate how to quickly prototype a platform like CheXplain while continuing to iterate and refine the models to meet both performance and end-user requirements. As we continue to iterate we plan on combining more datasets. This is a huge effort since there is not yet a single labeling terminology standard across all of the systems in which these datasets were acquired.
Acknowledgements
We would like to thank Dr. JaBaris Swain, MD, MPH for providing us insights on how to properly classify disease labels and for explaining the current workflow on reading x-rays from a clinical point-of-view.
We would also like to thank Jeremy Howard and Rachel Thomas, PhD. for creating an environment for us to learn together at their in-class fast.ai course in San Francisco. Their commitment to empowering underrepresented communities as well as increasing diversity in the artificial intelligence / deep learning space allowed us to meet each other and to fearlessly jump into collaborating together on our passion projects.
References
Pranav Rajpurkar, Jeremy Irvin, Kaylie Zhu, Brandon Yang, Hershel Mehta, Tony Duan, Daisy Ding, Aarti Bagul, Curtis Langlotz, Katie Shpanskaya, Matthew P. Lungren, and Andrew Y. Ng. CheXNet: Radiologist-Level Pneumonia Detection on Chest x-rays with Deep Learning. arXiv:1711.05225 [cs, stat], November 2017. arXiv: 1711.05225.
Shin, Hoo-Chang, et al. Learning to read chest x-rays: Recurrent neural cascade model for automated image annotation. Proceedings of the IEEE conference on computer vision and pattern recognition. 2016. arXiv: 1603.08486.
Wang X, Peng Y, Lu L, Lu Z, Bagheri M, Summers RM. ChestX-ray8: Hospital-scale Chest X-ray Database and Benchmarks on Weakly-Supervised Classification and Localization of Common Thorax Diseases. IEEE CVPR 2017, Link. Original source files and documents can be found here.
✅ You can test out the platform (we provide sample images for your convenience 💪🏾 ) at https://chexplain.trinlytics.com! 👀